Performance Analysis
Income, expenses and profit for any month, year to date or trailing twelve — against your targets.
Performance intelligence for healthcare practices: see what happened, decide what to do, and act where it actually changes the number.
Performance analysis and the drivers behind every number, measured against your own targets, with drift flagged while you can still act on it.
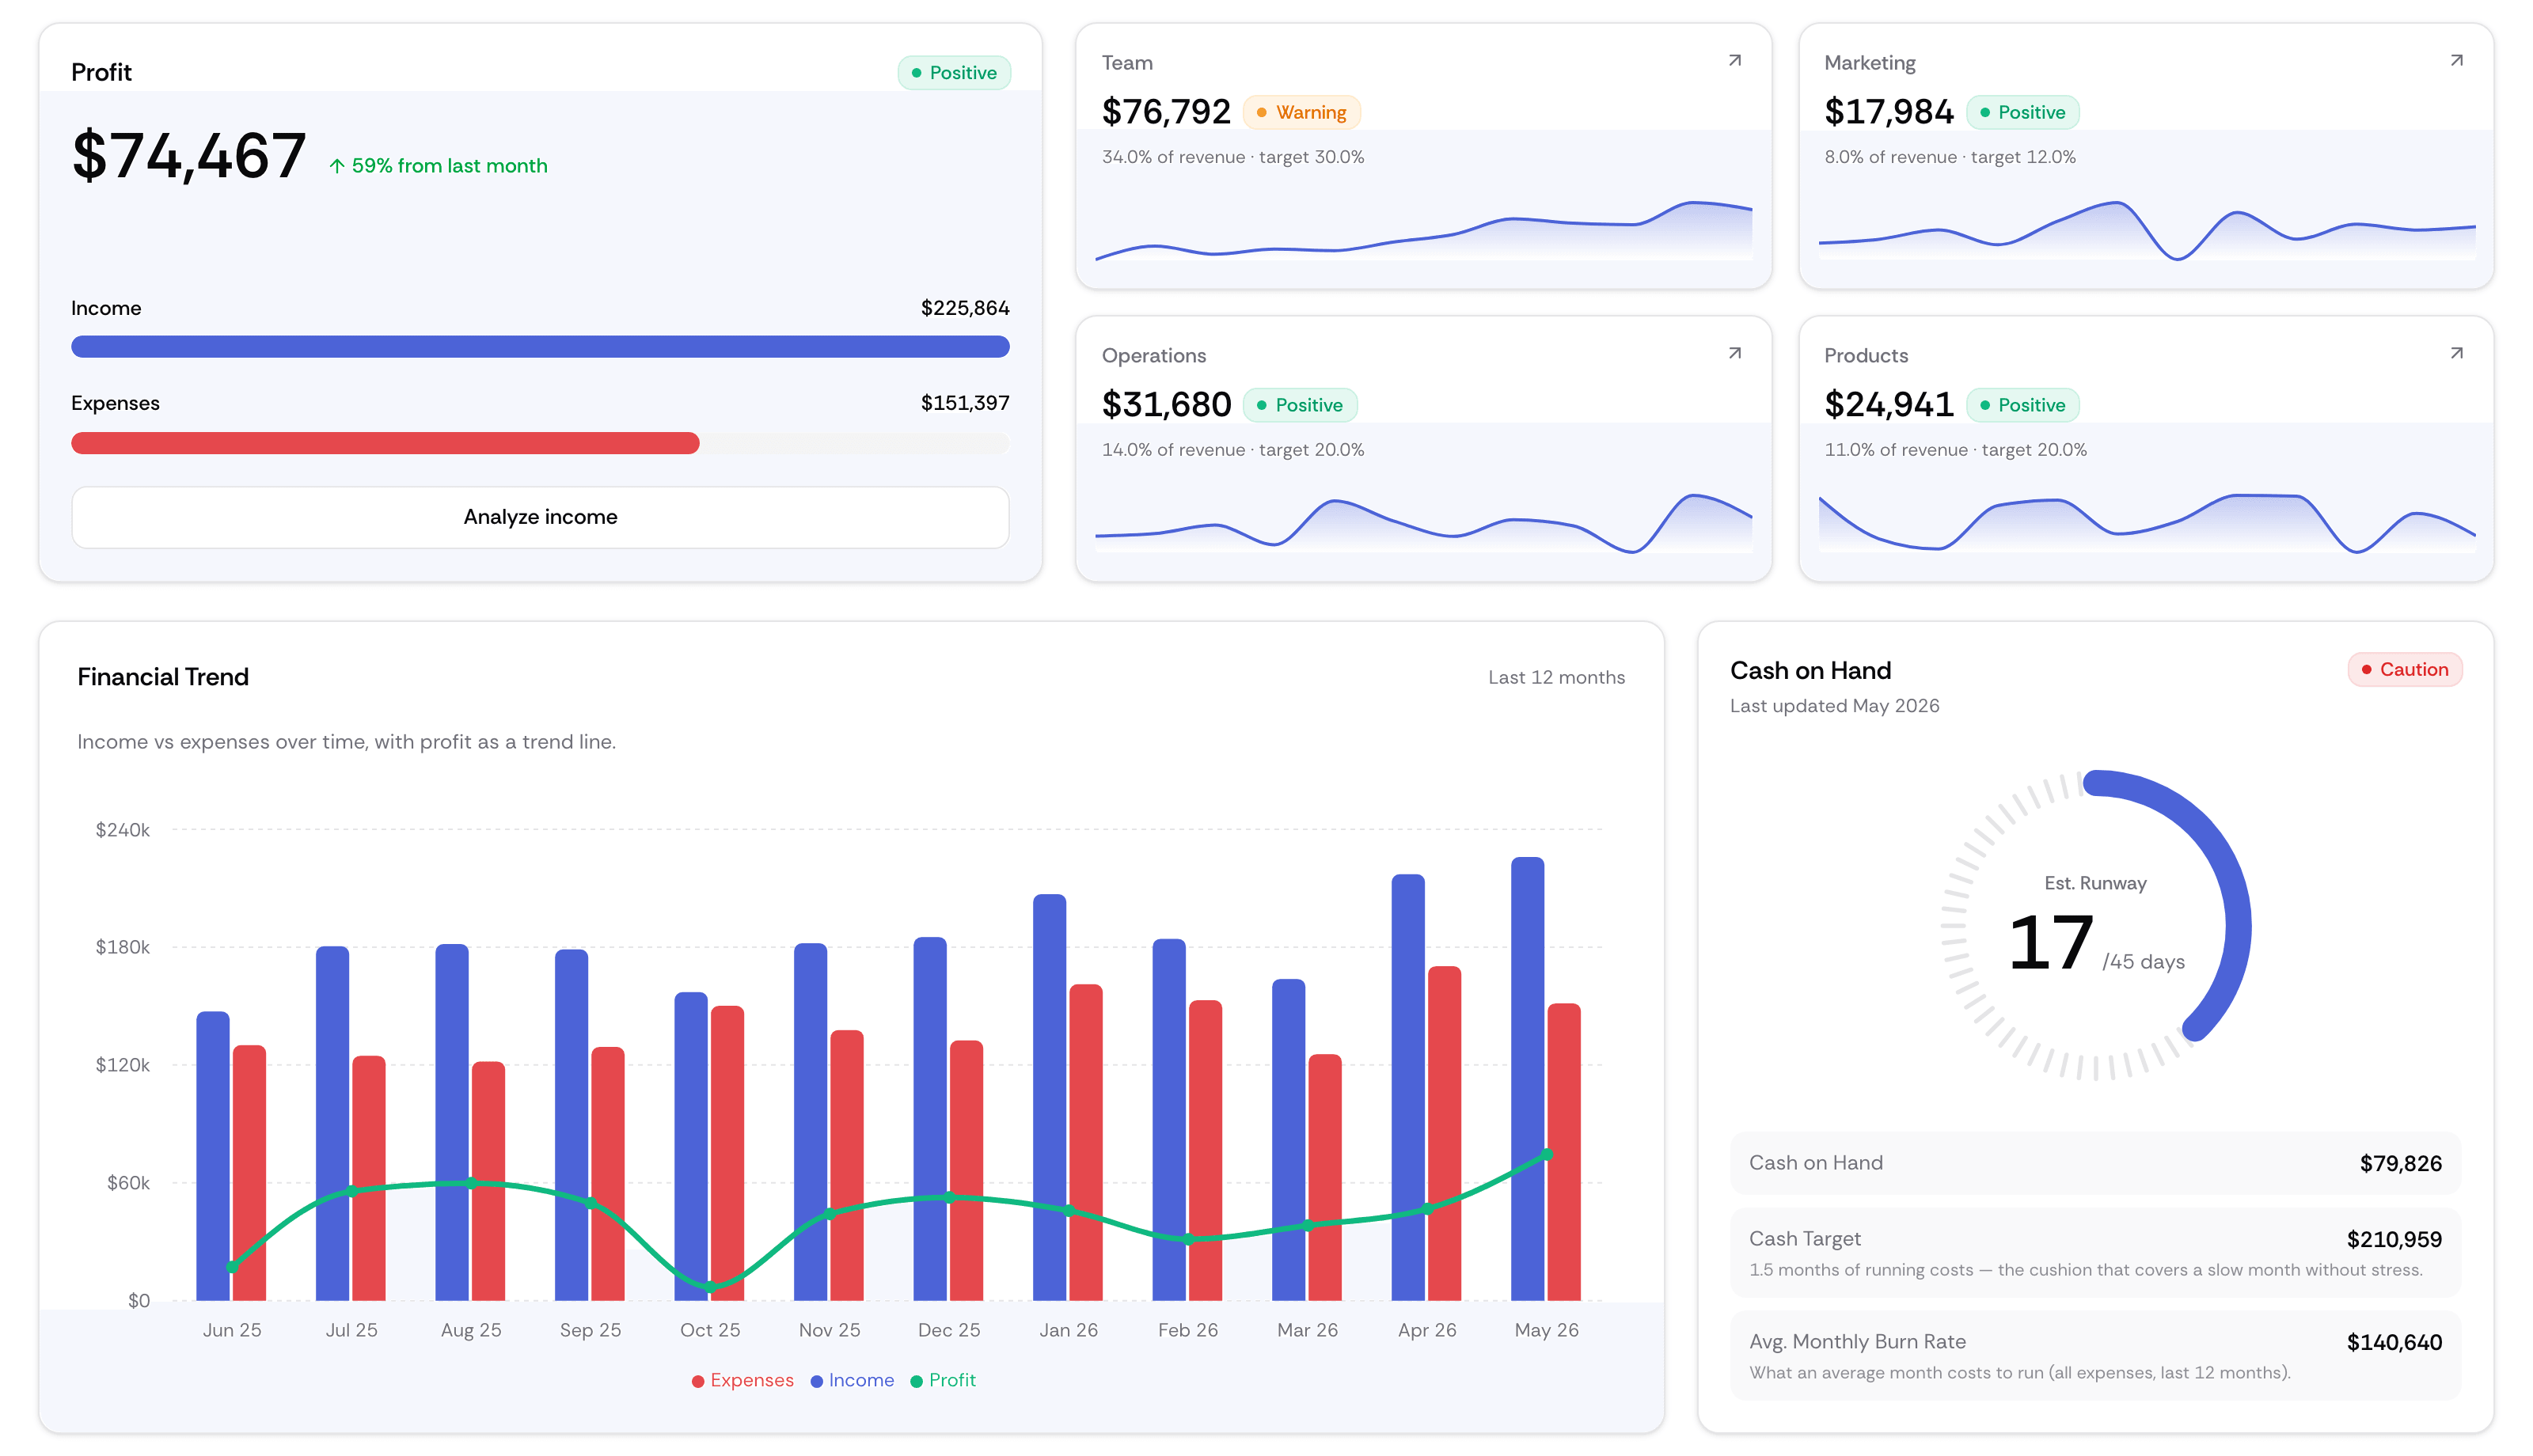
Income, expenses and profit for any month, year to date or trailing twelve — against your targets.
Turn “expenses feel high” into the specific line you can name and fix, with the history behind it.
Your numbers against practices in your revenue range: top 10%, top 25%, average.
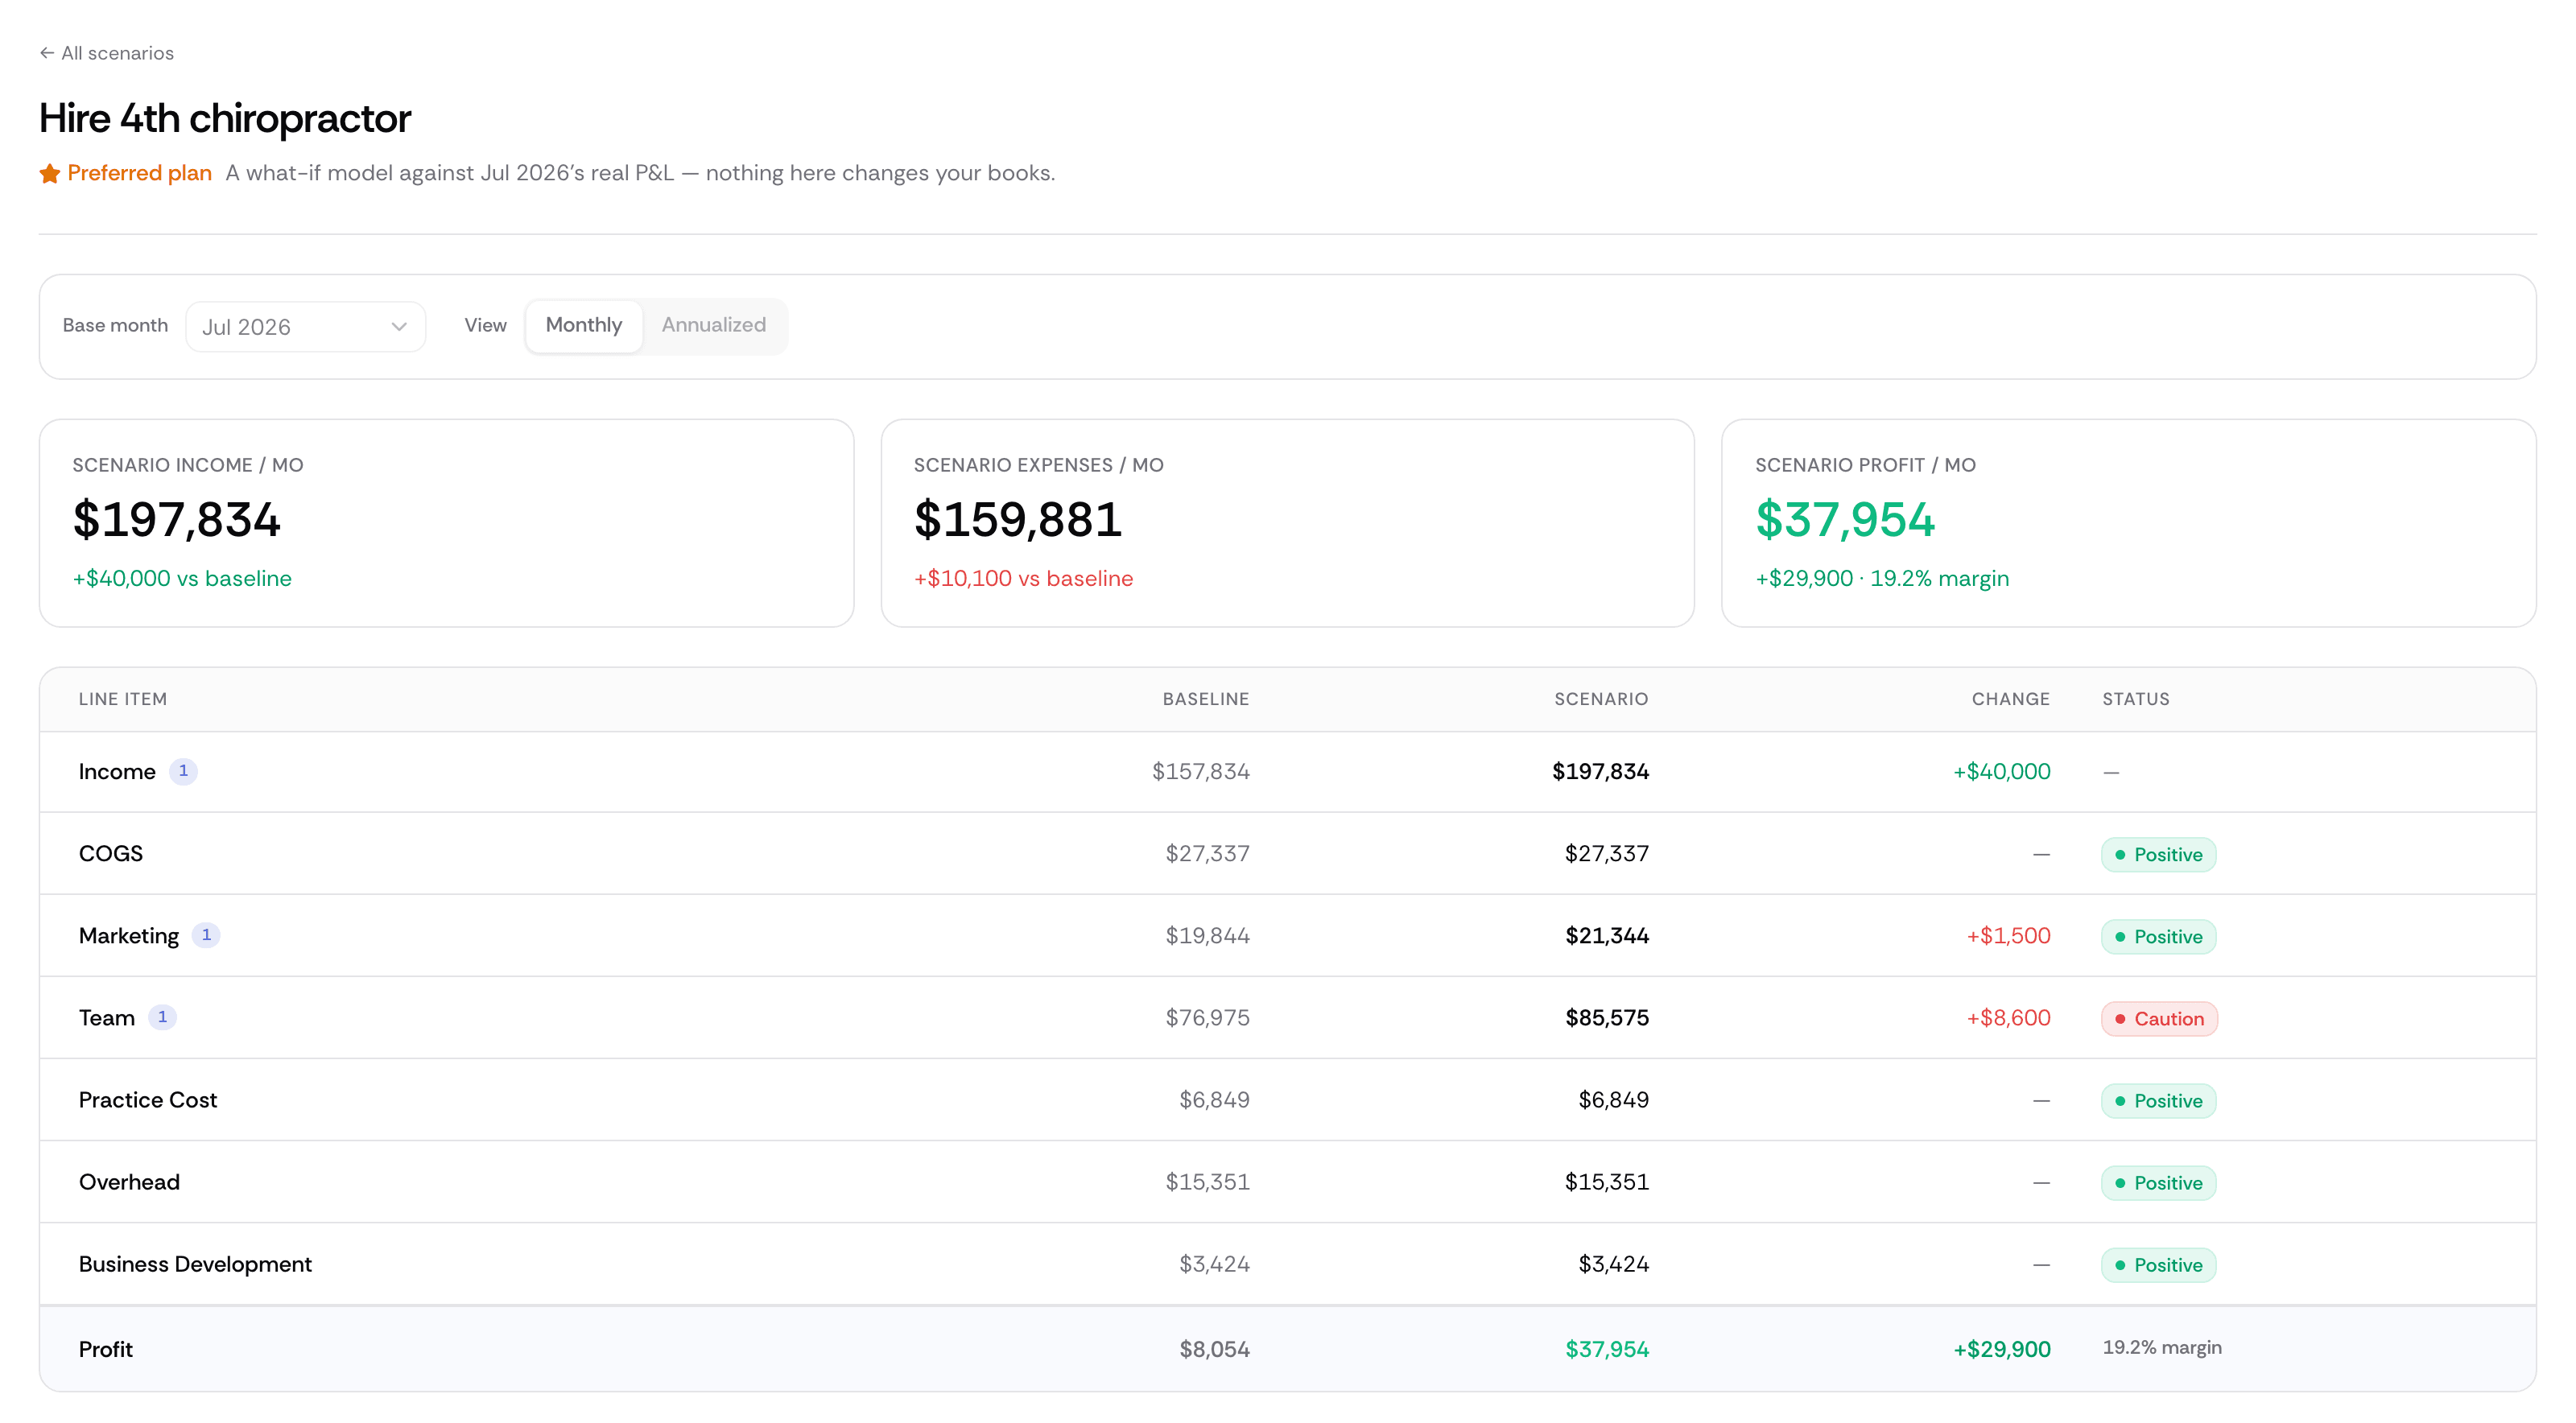
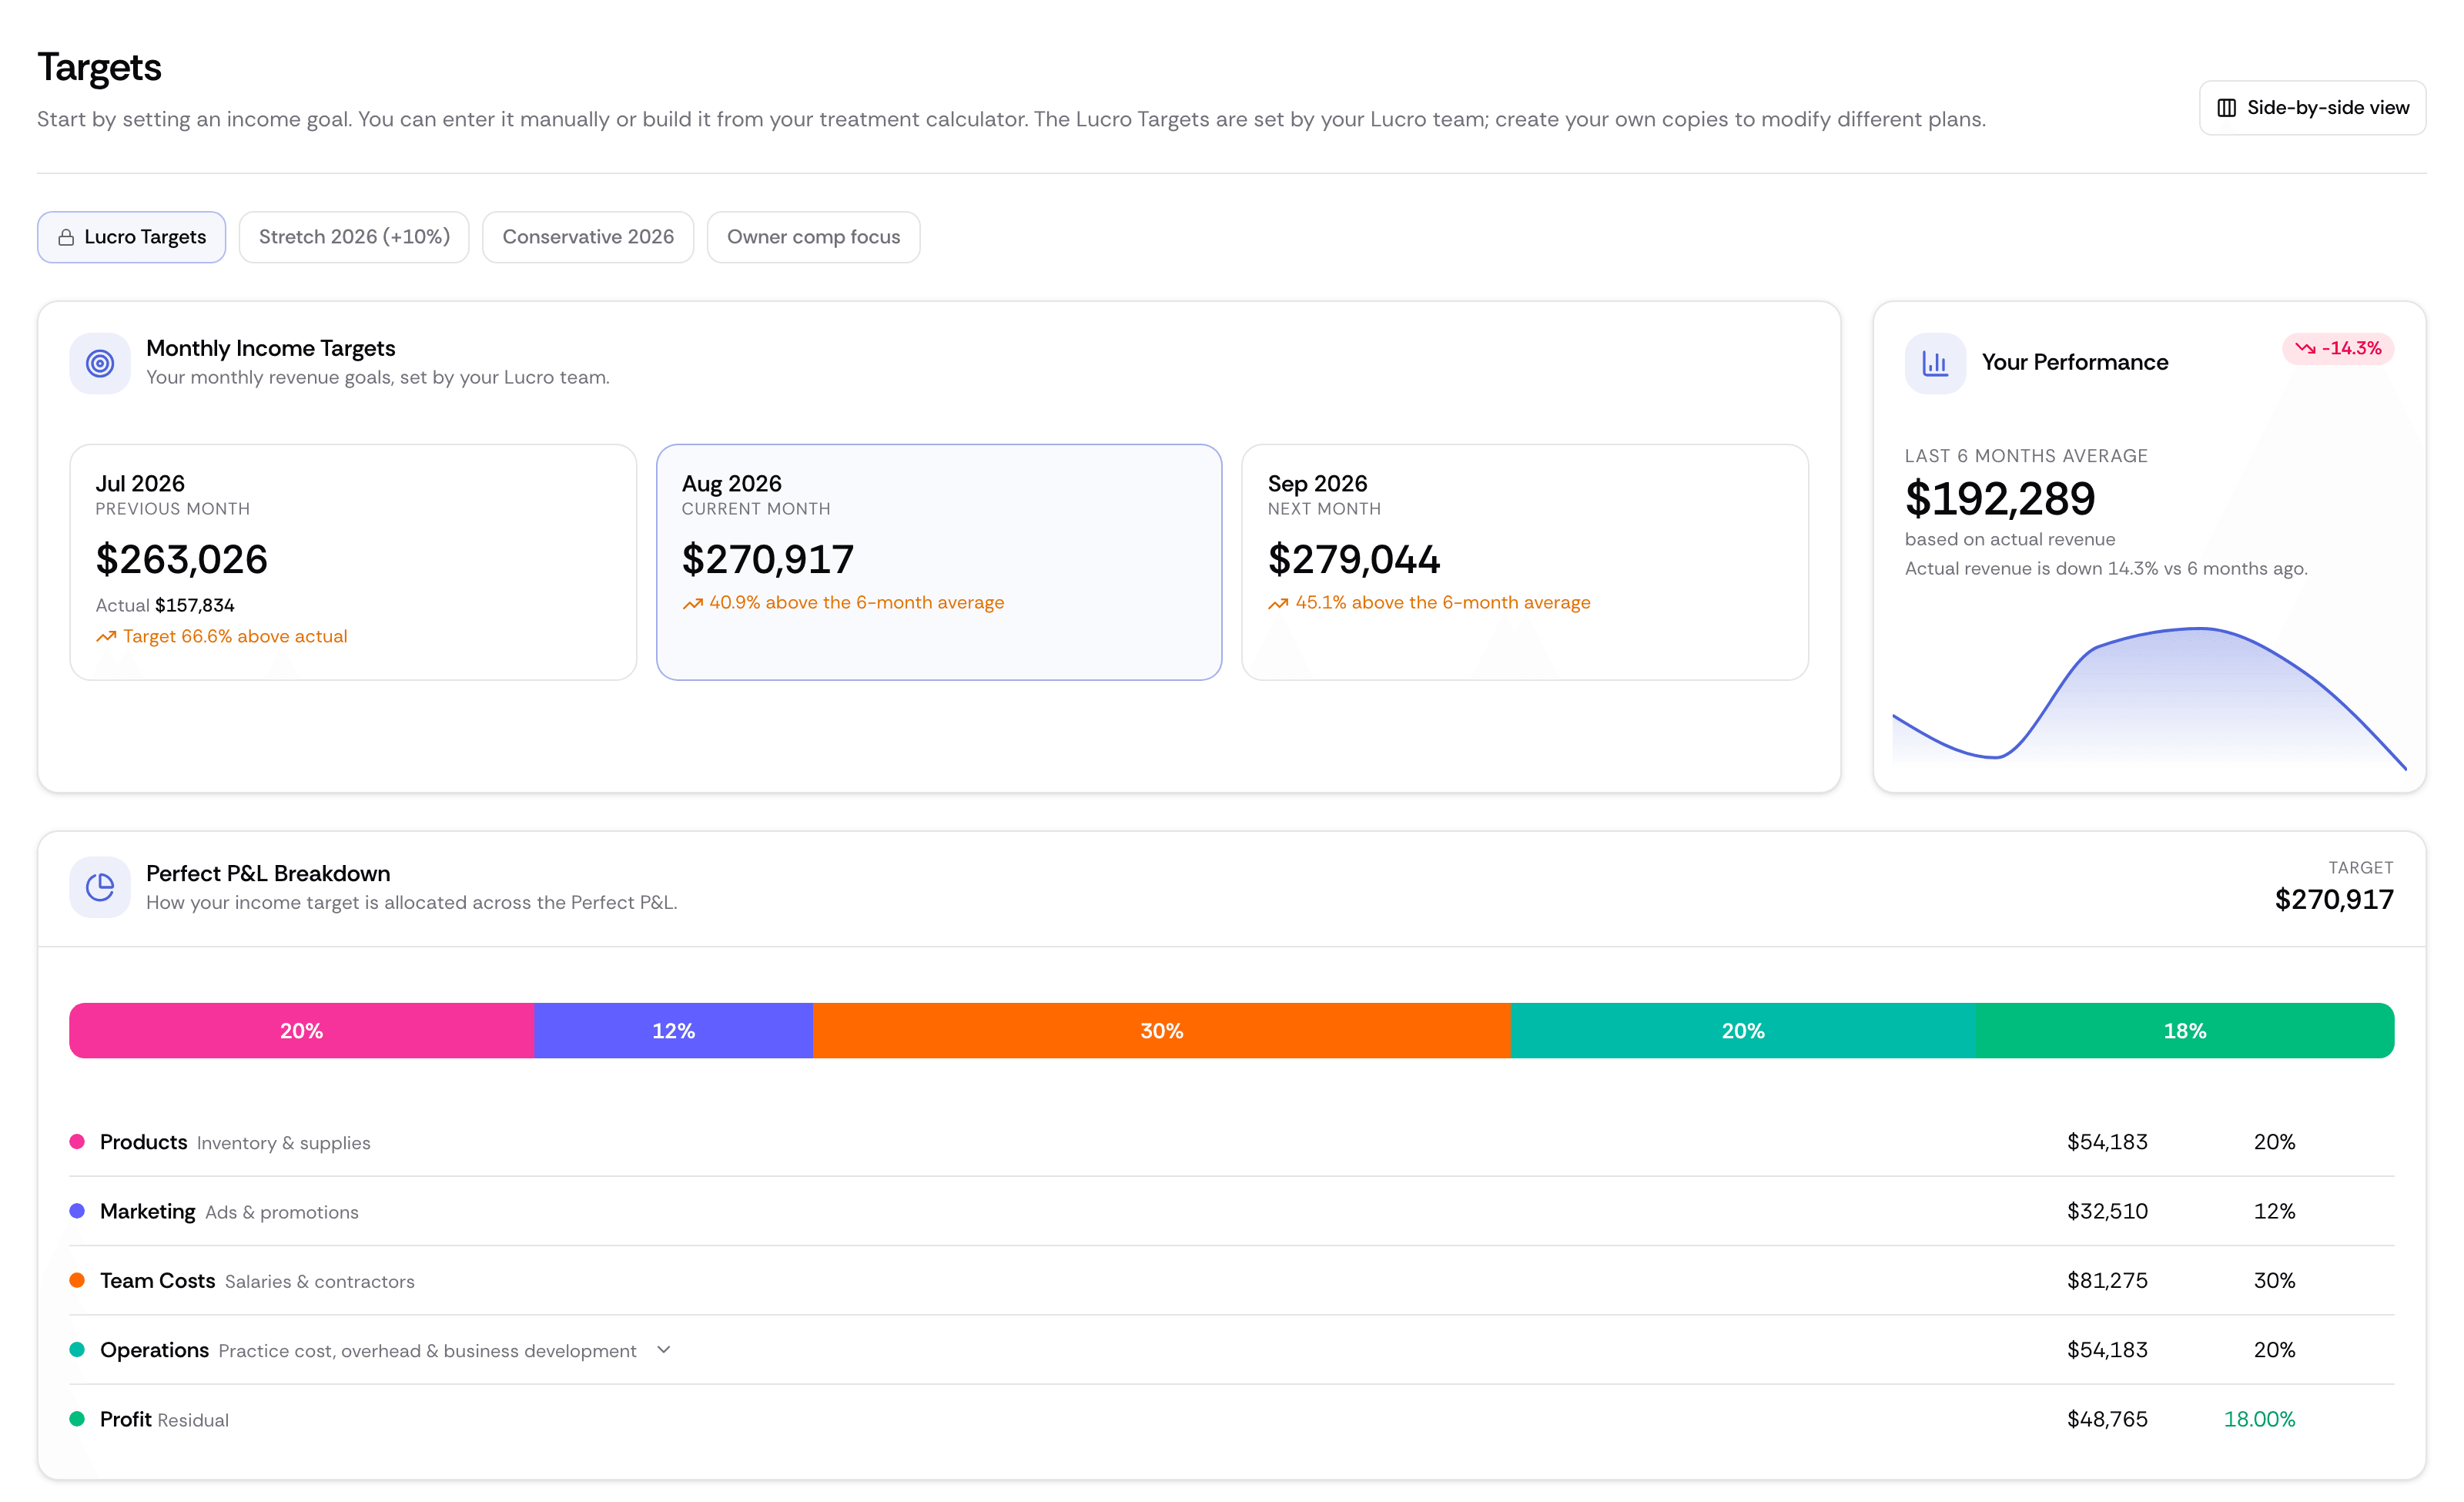
Set the standard, model the move, and know what your current providers, hours and rooms can actually absorb.
Set the standard by month and category, then see every result against it.
Model pricing, mix or team changes before you commit — on the screen, not the books.
What your providers, hours and rooms can absorb, where the bottleneck is, what has to change.
Financial results are made in scheduling, treatment mix and team structure. These connect the two.
What each service earns once chair time and cost are counted.
Model roles and pay against the revenue they support.
The frameworks and reference points owners actually use to run the business side well.
$45,490
average monthly profit increase in 8 months
Dr. Amanda
$71,575
average monthly profit increase in 5 months
Dr. Chad
$60,619
average monthly profit increase in 2 months
Dr. Gabriela
$58,947
average monthly profit increase in 3 months
Dr. Luke
63.34%
revenue growth in 5 months
Dr. James
167.38%
revenue growth in 4 months
Dr. James W.
−47.55%
decrease in expenses in one month
Dr. Sanio
Every tool on this page, on a fully populated demo practice — before you connect a thing.